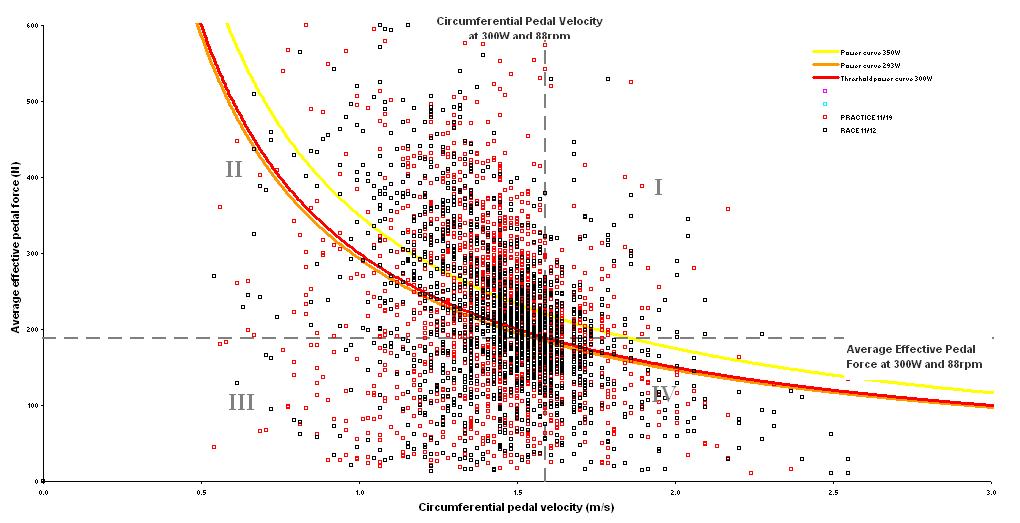
The multivariant quadrant analysis tool allows me to check this by comparing the effort in a race with one in practice in terms of circumferential pedal velocity (m/s) versus average effective pedal force (N). I broke down the quadrants in a previous post but here they are again:
Q1=high force and high velocity. At the extreme, this would represented by sprinting, but most any extended supra-threshold effort on level ground (e.g., attack or bridge attempt during a race) would entail "quadrant I pedaling".
Q2=high force but low velocity. Typically, "quadrant II pedaling" occurs when climbing or accelerating, especially from a low speed.Q3=low force and low velocity. Rides that entail a very large percentage of pedaling that falls into "quadrant III" would typically be those used for recovery or for social purposes (e.g., coffee shop rides), or for recovery in a race after an attack or sitting in.
Q4=low force but high velocity. Racing may also involve a significant amount of such low force, high velocity pedaling, especially during events in which there is a frequent need to accelerate rapidly (e.g., criteriums). (Coggan, Andrew, 2005. http://www.cyclingpeakssoftware.com/power411/quad.asp)Here is the comparison from a 50.6 minute practice session yesterday to the last race in Marietta which was 47.5 minutes long. These efforts were conductted on two different courses but both reflected largely solo efforts.
A

 B
BPlot A shows all of the data including zeros and plot B has the zeros removed and reflects pedaling power.
Observations:
Observations:
- Both plots show that most of the efforts are concentrated in Q2.
- The most common power points are concentrated between 250-350W with a significant concentration between 300-350W. Above this value the points get more scattered.
- The practice data is more scattered than the race data.
- The practice data shows more points above the 350W curve.
- The practice data also shows more Q3 points which reflects low power and more "recovery" efforts.


No comments:
Post a Comment